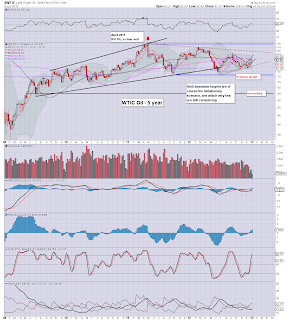
Whilst the US equity markets are still close to their post 2009 highs, WTIC Oil is well below the April 2011 high of $114, closing today @ $93. The near term outlook appears moderately bearish, but the monthly Oil charts have now flipped to bullish. A break above the big $100 this spring/summer would be pretty decisive.
WTIC Oil, daily
WTIC Oil, weekly
WTIC Oil, monthly2, rainbow
Summary
In the very near term, it does look like WTIC Oil will slip at least a few dollars lower. First target would be the 200 day MA @ $91.85. That could easily fail though, and open up the $90 level.
All things considered, it will be difficult for WTIC to break much below 89/88, not least if the main equity market holds above the key December low of sp'1398.
Bigger charts..bullish.
The fact we now have the monthly rainbow charts sporting a bullish green candle should not be too surprising, since we had both the Nov/Dec candles- blue, giving a provisional warning of a turn back to the upside.
The big psychological level of $100 will obviously be massive resistance. A weekly/monthly close >$100 would be very bullish into the spring/summer.
As always, the Oil price will be subject to changes in the US Dollar, and with annual QE of 1 trillion, there is obviously some inflationary upward pressure to ALL asset classes.
-
*I am short the sp' from 1457, seeking an initial exit around 1445/40.
Goodnight from London


